Global Top 100 companies (2019)
13.08.2019Company: PricewaterhouseCoopers Česká republika, s.r.o.
This unique report ranks the top 100 global companies by market capitalisation and compares how the list has evolved since 2018 and over the past ten years, from March 2009 to March 2019. It identifies the risers and fallers, looks at regional and sector dynamics and provides a view on how the global landscape has changed.
Market capitalisation
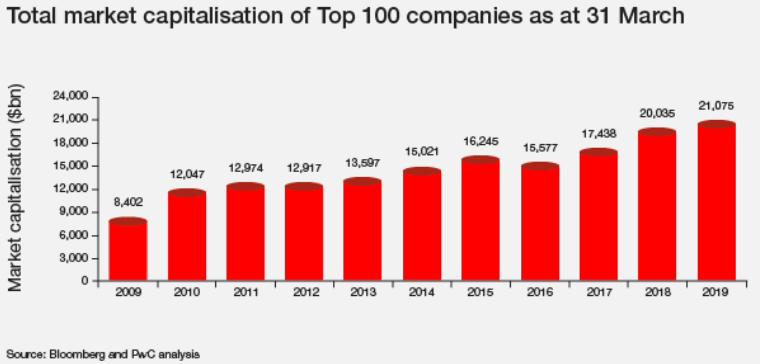
The market capitalisation of the largest company worldwide has nearly tripled in the past ten years — from US$337bn in 2009 to US$905bn in 2019. The gap between the largest and smallest companies in the 100 largest public companies has continued to grow, currently at $806bn.
Microsoft took the crown as the most valuable public company for the first time, after a seven-year reign by Apple. Technology and e-commerce companies dominate the top end of the rankings, with a tight cluster at the very top. The difference in market cap between number four and number one is US$88bn, but between number five and number four, it's US$340bn.
The US continues to dominate, with 54 companies in the Global Top 100, representing 63% of overall value, up from 51% ten years ago. Europe’s roster reduced by 11 companies, with a decline in its value share of 12% over the same period.
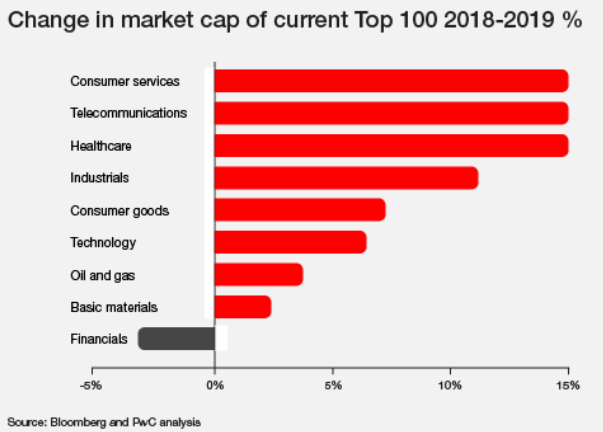
Technology sector retains lead in market capitalisation, but eclipsed in growth rate
Technology continues to hold its place as the largest sector in terms of market capitalisation (US$5,691bn). However, in terms of increase, healthcare, consumer services and telecommunications sectors grew by 15% each, compared to 6% growth for the technology sector.
The technology sector was hit hardest during the sell-off in the final few months of 2018; since then the sector has recovered strongly. Financials saw a 3% decline in market cap, although companies included in the Global Top 100 still outperformed the rest of the industry.
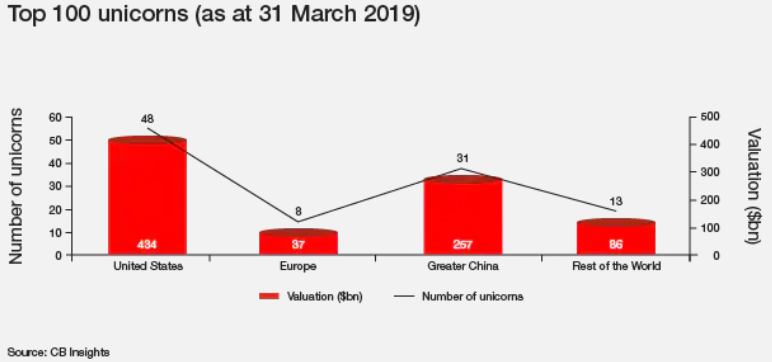
US and Greater China dominate amongst top 100 unicorns*
The value of the top 100 unicorns grew by 6% to $815bn over the year to 31 March 2019, consistent with their public company counterparts.
Nearly half (48%) of the top 100 unicorns as at 31 March 2019 were from the US, in line with what we see in the Global Top 100. Greater China provided a further 31%, a significantly larger proportion than in the Global Top 100.
* A unicorn is a privately held startup company valued at over $1bn
“The US continues to be the powerhouse of the Global Top 100, with the top four giants currently in a league of their own. Longer term, we expect to see a growing contribution from India and other developing markets with Greater China technology companies, in particular, challenging the current position. The prominence of companies from Greater China amongst the leading global unicorns may be a precursor of this.”
Ross Hunter – IPO Centre Leader, Partner, PwC United Kingdom
More information here.
More information in Czech language here.
Tags: Economics | Business Development |