Cisco Visual Networking Index: Global Mobile Data Traffic Forecast Update, 2016–2021 White Paper
12.04.2017Company: Amcham
The Cisco® Visual Networking Index (VNI) Global Mobile Data Traffic Forecast Update is part of the comprehensive Cisco VNI Forecast, an ongoing initiative to track and forecast the impact of visual networking applications on global networks. This report presents some of the major global mobile data traffic projections and growth trends.
The Mobile Network in 2016
Global mobile data traffic grew 63 percent in 2016. Global mobile data traffic reached 7.2 exabytes per month at the end of 2016, up from 4.4 exabytes per month at the end of 2015. (One exabyte is equivalent to one billion gigabytes, and one thousand petabytes.)
Mobile data traffic has grown 18-fold over the past 5 years. Mobile networks carried 400 petabytes per month in 2011.
Fourth-generation (4G) traffic accounted for 69% of mobile traffic in 2016. Although 4G connections represented only 26 percent of mobile connections in 2016, they already accounted for 69 percent of mobile data traffic, while 3G connections represented 33 percent of mobile connections and 24 percent of the traffic. In 2016, a 4G connection generated four times more traffic on average than a 3G connection.
Mobile offload exceeded cellular traffic by a significant margin in 2016. Sixty percent of total mobile data traffic was offloaded onto the fixed network through Wi-Fi or femtocell in 2016. In total, 10.7 exabytes of mobile data traffic were offloaded onto the fixed network each month.
Almost half a billion (429 million) mobile devices and connections were added in 2016. Smartphones accounted for most of that growth, followed by M2M modules. Global mobile devices and connections in 2016 grew to 8.0 billion, up from 7.6 billion in 2015.
Globally, smart devices represented 46 percent of the total mobile devices and connections in 2016; they accounted for 89 percent of the mobile data traffic. (For the purposes of this study, “smart devices” refers to mobile connections that have advanced multimedia/computing capabilities with a minimum of 3G connectivity.) In 2016, on an average, a smart device generated 13 times more traffic than a nonsmart device.
Mobile network (cellular) connection speeds grew more than 3-fold in 2016. Globally, the average mobile network downstream speed in 2016 was 6.8 Megabits per second (Mbps), up from 2.0 Mbps in 2015.
Mobile video traffic accounted for 60 percent of total mobile data traffic in 2016. Mobile video traffic now accounts for more than half of all mobile data traffic.
The top 1 percent of mobile data subscribers generated 6 percent of mobile data traffic, down from 8 percent in 2015 and 52 percent in 2010. According to a mobile data usage study conducted by Cisco, the top 20 percent of mobile users generated 56 percent of mobile data traffic, and the top 1 percent generated 6 percent.
Average smartphone usage grew 38 percent in 2016. The average amount of traffic per smartphone in 2016 was 1,614 MB per month, up from 1,169 MB per month in 2015.
Smartphones (including phablets) represented only 45 percent of total mobile devices and connections in 2016, but represented 81 percent of total mobile traffic. In 2016, the typical smartphone generated 48 times more mobile data traffic (1,614 MB per month) than the typical basic-feature cell phone (which generated only 33 MB per month of mobile data traffic).
Globally, there were 325 million wearable devices (a sub-segment of the machine-to-machine [M2M] category) in 2016. Of these, 11 million wearables had embedded cellular connections.
Per-user iOS mobile devices (smartphones and tablets) data usage surpassed that of Android mobile devices data usage. By the end of 2016, average iOS consumption exceeded average Android consumption in North America and Western Europe, where iOS usage was 4.8 GB per month and Android was 3.2 GB per month.
In 2016, 43 percent of mobile devices were potentially IPv6-capable. This estimate is based on network connection speed and OS capability.
In 2016, the number of mobile-connected tablets increased 26% to 184 million, and the number of mobile-connected PCs increased 8% to 136 million. In 2016, the average mobile data traffic per PC/Tablet was 3,392 MB per month, compared to 1,614 MB per month per smartphone.
Average nonsmartphone usage increased to 33 MB per month in 2016, compared to 23 MB per month in 2015. Basic handsets still make up 47 percent of handsets on the network.
The Mobile Network Through 2021
Mobile data traffic will reach the following milestones within the next 5 years:
● Monthly global mobile data traffic will be 49 exabytes by 2021, and annual traffic will exceed half a zettabyte.
● Mobile will represent 20 percent of total IP traffic by 2021.
● The number of mobile-connected devices per capita will reach 1.5 by 2021.
● The average global mobile connection speed will surpass 20 Mbps by 2021.
● The total number of smartphones (including phablets) will be over 50 percent of global devices and connections by 2021.
● Smartphones will surpass four-fifths of mobile data traffic (86 percent) by 2021.
● 4G connections will have the highest share (53 percent) of total mobile connections by 2021.
● 4G traffic will be more than three-quarters of the total mobile traffic by 2021.
● More traffic was offloaded from cellular networks (on to Wi-Fi) than remained on cellular networks in 2016.
● Over three-fourths (78 percent) of the world’s mobile data traffic will be video by 2021.
Global mobile data traffic will increase sevenfold between 2016 and 2021. Mobile data traffic will grow at a compound annual growth rate (CAGR) of 47 percent from 2016 to 2021, reaching 49.0 exabytes per month by 2021.
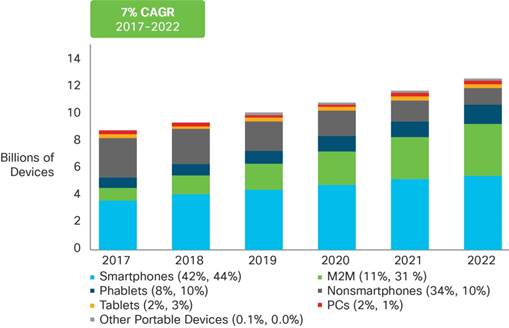
By 2021 there will be 1.5 mobile devices per capita. There will be 11.6 billion mobile-connected devices by 2021, including M2M modules—exceeding the world’s projected population at that time (7.8 billion).
Mobile network connection speeds will increase threefold by 2021. The average mobile network connection speed (6.8 Mbps in 2016) will reach 20.4 megabits per second (Mbps) by 2021.
By 2021, 4G will be 53 percent of connections, but 79 percent of total traffic. By 2021, a 4G connection will generate twice as much traffic on average as a 3G connection.
By 2021, 5G will be 0.2 percent of connections (25 million), but 1.5 percent of total traffic. By 2021, a 5G connection will generate 4.7 times more traffic than the average 4G connection.
By 2021, nearly three-quarters of all devices connected to the mobile network will be “smart” devices. Globally, 74.7 percent of mobile devices will be smart devices by 2021, up from 36.7 percent in 2016. The vast majority of mobile data traffic (98 percent) will originate from these smart devices by 2021, up from 89 percent in 2016.
By 2021, 73 percent of all global mobile devices could potentially be capable of connecting to an IPv6 mobile network. There will be 8.4 billion IPv6-capable devices by 2021.
More than three-fourths of the world’s mobile data traffic will be video by 2021. Mobile video will increase 9-fold between 2016 and 2021, accounting for 78 percent of total mobile data traffic by the end of the forecast period.
By 2021, mobile-connected tablets and PCs will generate 8.0 GB of traffic per month, a doubling over the 2016 average of 3.4 GB per month. Aggregate traffic associated with PCs and tablets will be four times greater than it is today, with a CAGR of 33 percent.
The average smartphone will generate 6.8 GB of traffic per month by 2021, a fourfold increase over the 2016 average of 1.6 GB per month. By 2021, aggregate smartphone traffic will be seven times greater than it is today, with a CAGR of 48 percent.
By 2016, 63 percent of all traffic from mobile-connected devices (almost 84 exabytes) will be offloaded to the fixed network by means of Wi-Fi devices and femtocells each month. Of all IP traffic (fixed and mobile) in 2021, 50% will be Wi-Fi, 30% will be wired, and 20% will be mobile.
The Middle East and Africa will have the strongest mobile data traffic growth of any region with a 65 percent CAGR. This region will be followed by Asia Pacific at 49 percent and Latin America at 45 percent.
China’s mobile traffic will surpass that of the United States by the end of 2017. China’s mobile traffic will reach 1.9 exabytes per month by the end of 2017, and mobile traffic in the United States will reach 1.6 exabytes per month.
Appendix A summarizes the details and methodology of the VNI Mobile Forecast.
2016 Year in Review
Global mobile data traffic grew an estimated 63 percent in 2016. Growth rates varied widely by region, with Middle East and Africa having the highest growth rate (96 percent) followed by Asia Pacific (71 percent), Latin America (66 percent), and Central and Eastern Europe (64 percent). Western Europe grew at an estimated 52 percent, and North America trailed Western Europe at 44 percent growth in 2016 (refer to Figure 1). At the country level, Indonesia, China, and India led global growth at 142, 86, and 76 percent, respectively. These three countries also topped traffic growth in 2015, though in 2016 Indonesia’s traffic growth accelerated (versus 129 percent in 2015), and the traffic growth in China and India slowed relative to 2015 (when growth was 89 percent in India, and 111 percent in China). France, Korea, and Australia also experienced an acceleration in mobile traffic growth in 2016, while most other countries experienced strong but tapering growth compared with previous years.
Figure 1. Mobile Data Traffic Growth in 2016
Source: Cisco VNI Mobile, 2017
Global Mobile Data Traffic, 2016 to 2021
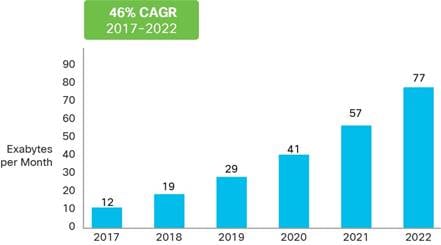
Overall mobile data traffic is expected to grow to 49 exabytes per month by 2021, a sevenfold increase over 2016. Mobile data traffic will grow at a CAGR of 47 percent from 2016 to 2021 (Figure 2).
Figure 2. Cisco Forecasts 49 Exabytes per Month of Mobile Data Traffic by 2021
Source: Cisco VNI Mobile, 2017
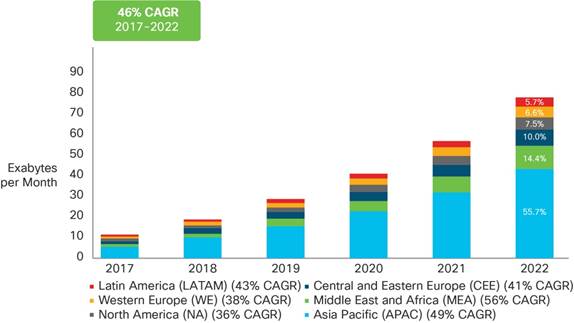
Asia Pacific will account for 47 percent of global mobile traffic by 2021, the largest share of traffic by any region by a substantial margin, as shown in Figure 3. North America, which had the second-largest traffic share in 2016, will have only the fourth-largest share by 2021, having been surpassed by Central and Eastern Europe and Middle East and Africa. Middle East and Africa will experience the highest CAGR of 65 percent, increasing 12-fold over the forecast period. Asia Pacific will have the second-highest CAGR of 49 percent, increasing 7-fold over the forecast period (Figure 3).
Figure 3. Global Mobile D ata T raffic Forec ast by Region
More information can be downloaded here.
Tags: Business Development | IT |